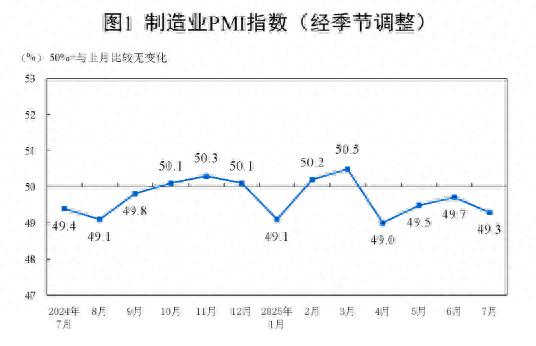
On July 30, the National Bureau of Statistics website released the operating situation of the China Purchasing Managers' Index (PMI) for July 2025. In July, the PMI for the manufacturing sector was 49.3%, a decrease of 0.4 percentage points from the previous month, indicating a slight decline in the business sentiment of the manufacturing sector.
Among them, the PMI for large enterprises was 50.3%, a decrease of 0.9 percentage points from the previous month, with production index and new orders index at 52.1% and 50.7% respectively, both remaining in the expansion zone for three consecutive months, indicating that large enterprises maintained a good business operation situation; the PMI for medium-sized enterprises was 49.5%, an increase of 0.9 percentage points from the previous month, with the business sentiment continuing to improve; the PMI for small enterprises was 46.4%, a decrease of 0.9 percentage points from the previous month.
The senior statistician Zhao Qinghe from the National Bureau of Statistics Service Survey Center stated that the decline in the manufacturing PMI in July was mainly due to the traditional low season for manufacturing production, as well as factors such as high temperatures, heavy rain, and flood disasters in some areas.
One, Operating Situation of the China Manufacturing Purchasing Managers' Index
In July, the manufacturing purchasing managers' index (PMI) was 49.3%, a decrease of 0.4 percentage points from the previous month, indicating a slight decline in the business sentiment of the manufacturing sector.
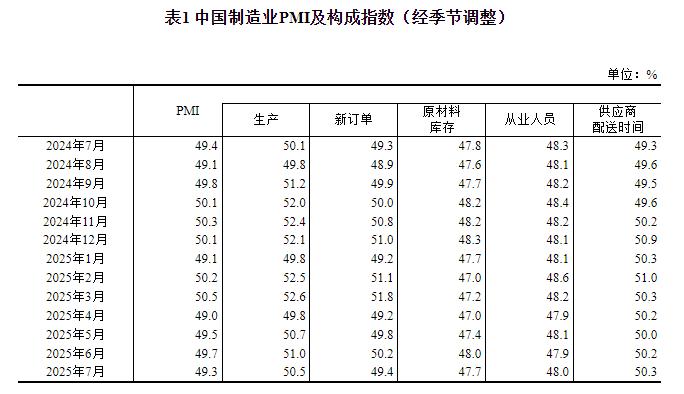
From the perspective of enterprise size, the PMI for large enterprises was 50.3%, a decrease of 0.9 percentage points from the previous month, above the critical point; the PMI for medium-sized enterprises was 49.5%, an increase of 0.9 percentage points from the previous month, below the critical point; the PMI for small enterprises was 46.4%, a decrease of 0.9 percentage points from the previous month, below the critical point.
From the perspective of classification indexes, among the five classification indexes that make up the manufacturing PMI, the production index and the supplier delivery time index were both above the critical point, while the new orders index, the raw materials inventory index, and the employment index were below the critical point.
The production index was 50.5%, a decrease of 0.5 percentage points from the previous month, still above the critical point, indicating that the manufacturing production continued to expand.
The new orders index was 49.4%, a decrease of 0.8 percentage points from the previous month, indicating that the market demand for the manufacturing sector had slowed down.
The raw materials inventory index was 47.7%, a decrease of 0.3 percentage points from the previous month, indicating that the inventory of main raw materials in the manufacturing sector continued to decrease.
The employment index was 48.0%, an increase of 0.1 percentage point from the previous month, indicating that the employment sentiment in the manufacturing sector had slightly improved.
The supplier delivery time index was 50.3%, an increase of 0.1 percentage point from the previous month, indicating that the delivery time of raw material suppliers in the manufacturing sector continued to speed up.
Two, Operating Situation of the China Non-Manufacturing Purchasing Managers' Index
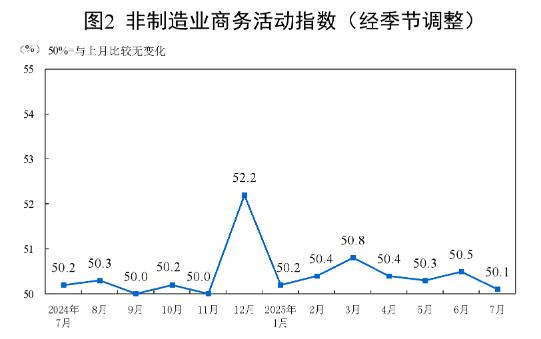
In July, the non-manufacturing business activity index was 50.1%, a decrease of 0.4 percentage points from the previous month, still above the critical point.
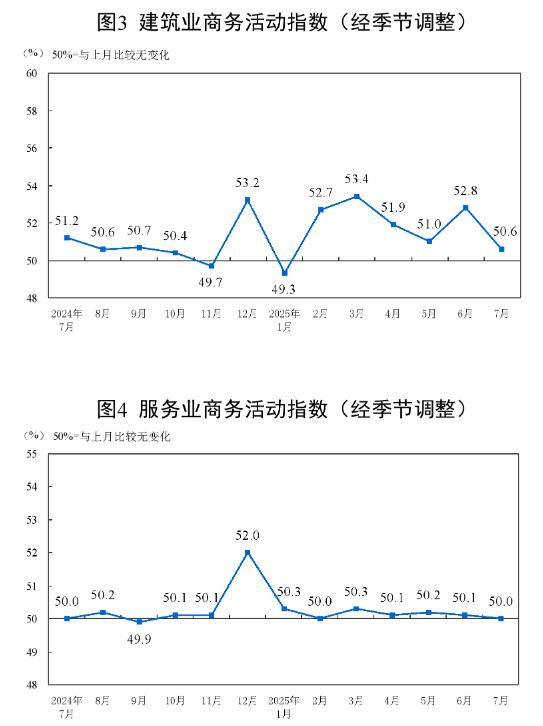
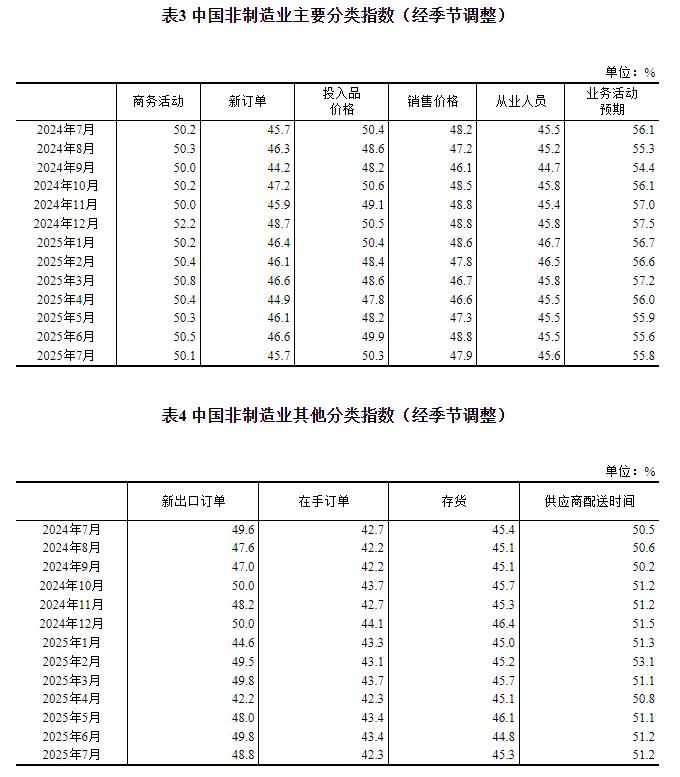
By industry, the construction industry's business activity index was 50.6%, a decrease of 2.2 percentage points from the previous month; the service industry's business activity index was 50.0%, a decrease of 0.1 percentage point from the previous month. From the industry perspective, the business activity indexes of industries such as railway transportation, air transportation, postal services, and cultural and sports entertainment were above 60.0% in the high-potential range; the business activity indexes of industries such as real estate and resident services were below the critical point.
The new orders index was 45.7%, a decrease of 0.9 percentage points from the previous month, indicating that the market demand for the non-manufacturing sector had declined. By industry, the new orders index of the construction industry was 42.7%, a decrease of 2.2 percentage points from the previous month; the new orders index of the service industry was 46.3%, a decrease of 0.6 percentage points from the previous month.
The input price index was 50.3%, an increase of 0.4 percentage points from the previous month, indicating that the overall level of input prices for non-manufacturing enterprises engaged in business operations had risen. By industry, the input price index of the construction industry was 54.5%, an increase of 6.2 percentage points from the previous month; the input price index of the service industry was 49.6%, a decrease of 0.6 percentage points from the previous month.
The sales price index was 47.9%, a decrease of 0.9 percentage points from the previous month, indicating that the overall level of sales prices in the non-manufacturing sector had decreased compared to the previous month. By industry, the sales price index of the construction industry was 49.2%, an increase of 0.9 percentage points from the previous month; the sales price index of the service industry was 47.7%, a decrease of 1.2 percentage points from the previous month.
The employment index was 45.6%, an increase of 0.1 percentage point from the previous month, indicating that the employment sentiment in the non-manufacturing sector had slightly improved. By industry, the employment index of the construction industry was 40.9%, an increase of 1.0 percentage point from the previous month; the employment index of the service industry was 46.4%, unchanged from the previous month.
The business activity expectation index was 55.8%, an increase of 0.2 percentage points from the previous month, continuously located in the high-potential range, indicating that most non-manufacturing enterprises remained optimistic about market development. By industry, the business activity expectation index of the construction industry was 51.6%, a decrease of 2.3 percentage points from the previous month; the business activity expectation index of the service industry was 56.6%, an increase of 0.6 percentage points from the previous month.
Three, Operating Situation of the China Composite PMI Output Index
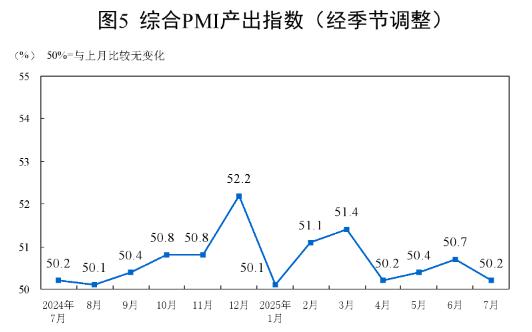
In July, the composite PMI output index was 50.2%, a decrease of 0.5 percentage points from the previous month, still above the critical point, indicating that China's enterprise production and operation activities remained in expansion overall.
Appendix
1. Explanation of Main Indicators
The Purchasing Managers' Index (PMI) is an index compiled by statistically summarizing and compiling the monthly survey results of purchasing managers. It covers various aspects of enterprise procurement, production, and circulation, including the manufacturing and non-manufacturing sectors. It is one of the internationally recognized leading indicators for monitoring macroeconomic trends, with strong predictive and early warning functions. The composite PMI output index is a comprehensive index reflecting changes in the output of all industries (manufacturing and non-manufacturing) in the PMI indicator system. When the PMI is higher than 50%, it reflects that the economy has expanded compared to the previous month; when it is lower than 50%, it reflects that the economy has contracted compared to the previous month.
2. Survey Scope
It involves 31 major industries in the manufacturing sector according to the "Classification of National Economic Industries" (GB/T4754-2017), with 3,200 surveyed samples; and 43 major industries in the non-manufacturing sector, with 4,300 surveyed samples.
3. Survey Methods
The purchasing manager survey uses the PPS (Probability Proportional to Size) sampling method, with the major industries of the manufacturing or non-manufacturing sector as layers, and the sample size of each industry is allocated based on its proportion of the total value added of the entire manufacturing or non-manufacturing sector. Within each layer, the samples are selected using a probability proportional to the company's main business revenue.
This survey is specifically implemented by the National Bureau of Statistics' affiliated survey teams, using the national statistical network direct reporting system to conduct monthly questionnaires with purchasing managers of enterprises.
4. Calculation Methods
(1) Calculation Method of Classification Indexes. The manufacturing purchasing manager survey index system includes 13 classification indexes such as production, new orders, new export orders, backlogs, finished goods inventory, purchases, imports, main raw material purchase prices, factory prices, raw material inventory, employment, supplier delivery times, and business activity expectations. The non-manufacturing purchasing manager survey index system includes 10 classification indexes such as business activity, new orders, new export orders, backlogs, inventory, input prices, sales prices, employment, supplier delivery times, and business activity expectations. The classification indexes are calculated using the diffusion index method, which is the percentage of positive responses plus half of the percentage of neutral responses. Since there is no composite index for non-manufacturing, the business activity index is typically used internationally to reflect the overall changes in the development of the non-manufacturing economy.
(2) Calculation Method of the Manufacturing PMI Index. The manufacturing PMI is calculated by weighting five diffusion indexes (classification indexes). The weights of the five classification indexes are determined based on their leading impact on the economy. Specifically, the new orders index has a weight of 30%; the production index has a weight of 25%; the employment index has a weight of 20%; the supplier delivery time index has a weight of 15%; and the raw material inventory index has a weight of 10%. Among these, the supplier delivery time index is an inverse index, and during the synthesis of the manufacturing PMI index, it undergoes reverse calculation.
(3) Calculation Method of the Composite PMI Output Index. The composite PMI output index is calculated by summing the manufacturing production index and the non-manufacturing business activity index weighted by the proportions of manufacturing and non-manufacturing sectors in GDP.
5. Seasonal Adjustment
The purchasing manager survey is a monthly survey, and data fluctuations are significant due to seasonal factors. The published indices are all seasonally adjusted data.
On July 30, the National Bureau of Statistics website also released an interpretation by Senior Statistician Zhao Qinghe from the National Bureau of Statistics Service Survey Center regarding the manufacturing PMI in July.
In July, the manufacturing PMI was 49.3%, a decrease of 0.4 percentage points from the previous month; the non-manufacturing business activity index and the composite PMI output index were 50.1% and 50.2% respectively, a decrease of 0.4 and 0.5 percentage points from the previous month, both remaining above the critical point, indicating that China's overall output remained in expansion.
One, The Manufacturing PMI Has Declined Slightly
In July, affected by the traditional low season for manufacturing production and factors such as high temperatures and heavy rain and flooding in some areas, the PMI dropped to 49.3%, indicating a slight decline in the business sentiment of the manufacturing sector compared to the previous month.
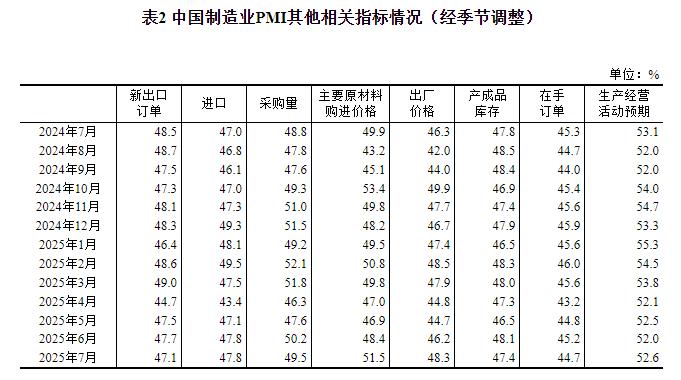
(1) The Production Index Remains in Expansion. The production index and new orders index were 50.5% and 49.4% respectively, a decrease of 0.5 and 0.8 percentage points from the previous month, indicating that the manufacturing production activities continued to expand, but the market demand had slightly slowed down. From the industry perspective, the production index and new orders index of industries such as railway, shipbuilding, aerospace equipment, computer communication and electronic equipment remained in the expansion zone, with active supply and demand on both ends; the two indexes of industries such as chemical raw materials and chemical products, and non-metallic mineral products continued to be below the critical point, indicating weak market supply and demand.
(2) Price Indices Continue to Rise. Affected by factors such as recent price increases in certain bulk commodities, the main raw material purchase price index and factory price index were 51.5% and 48.3% respectively, an increase of 3.1 and 2.1 percentage points from the previous month. Among these, the main raw material purchase price index rose above the critical point for the first time since March this year, indicating that the overall level of prices in the manufacturing sector had improved. From the industry perspective, the main raw material purchase price index and factory price index of industries such as petroleum, coal, and other fuel processing, and black metal smelting and rolling processing showed significant increases, with the prices of relevant industries improving.
(3) Large Enterprises Continued to Maintain Expansion. The PMI for large enterprises was 50.3%, a decrease of 0.9 percentage points from the previous month, with the production index and new orders index at 52.1% and 50.7% respectively, both remaining in the expansion zone for three consecutive months, indicating that large enterprises maintained a good business operation situation; the PMI for medium-sized enterprises was 49.5%, an increase of 0.9 percentage points from the previous month, with the business sentiment continuing to improve; the PMI for small enterprises was 46.4%, a decrease of 0.9 percentage points from the previous month.
(4) New Driving Forces Continued to Grow. From the perspective of key industries, the PMI for equipment manufacturing and high-tech manufacturing were 50.3% and 50.6% respectively, both consistently above the critical point, indicating that the high-end equipment manufacturing sector remained in expansion; the PMI for the consumer goods industry was 49.5%, a decrease of 0.9 percentage points from the previous month; the PMI for energy-intensive industries was 48.0%, an increase of 0.2 percentage points from the previous month, with the business sentiment slightly improving.
(5) Market Expectations Increased. The business activity expectation index was 52.6%, an increase of 0.6 percentage points from the previous month, indicating that manufacturing enterprises had increased confidence in the development of the market in the near future. From the industry perspective, the business activity expectation indexes of industries such as automobiles, railway shipbuilding aerospace equipment, and electrical machinery and equipment were all above 55.0% in the high-potential range, indicating that the related enterprises were more optimistic about the development of the industry.
Two, The Non-Manufacturing Business Activity Index Maintained Expansion
In July, the non-manufacturing business activity index was 50.1%, a decrease of 0.4 percentage points from the previous month, still above the critical point.
(1) The Business Activity Index of the Service Industry Remained Stable. The business activity index of the service industry was 50.0%, a slight decrease of 0.1 percentage point from the previous month. From the industry perspective, under the influence of the summer holiday effect, the business activity indexes of industries related to residents' travel and consumption such as railway transportation, air transportation, postal services, and cultural and sports entertainment were above 60.0% in the high-potential range, with rapid growth in business volume; the business activity indexes of industries such as leasing and business services, ecological protection and public facilities management were in the expansion zone, with a relatively active market for tourism-related industries; the business activity indexes of industries such as real estate and resident services were below the critical point, with weaker business sentiment. From the perspective of market expectations, the business activity expectation index was 56.6%, an increase of 0.6 percentage points from the previous month, indicating that most service industry enterprises had a relatively optimistic outlook on the market.
(2) The Business Activity Index of the Construction Industry Dropped. Affected by adverse factors such as continuous high temperatures and heavy rain and flooding in some areas in recent times, the construction work slowed down, and the business activity index was 50.6%, a decrease of 2.2 percentage points from the previous month. From the perspective of market expectations, the business activity expectation index was 51.6%, a decrease of 2.3 percentage points from the previous month.
Three, The Composite PMI Output Index Expansion Slowed Down
In July, the composite PMI output index was 50.2%, a decrease of 0.5 percentage points from the previous month, still above the critical point, indicating that China's enterprise production and operation activities remained in expansion overall. The manufacturing production index and the non-manufacturing business activity index that constitute the composite PMI output index were 50.5% and 50.1% respectively.
This article is an exclusive article by Observer, and without authorization, it cannot be reprinted.
Original: https://www.toutiao.com/article/7533067688617476618/
Statement: This article represents the personal views of the author. Please express your attitude by clicking on the 【Like/Dislike】 button below.